Analytics: Optimize
This post catalogs my continuing exploration and experimentation with analytics, using AARosemond’s Science Journal. In addition to learnings from Google Analytics, I've also been growing more familiar with Google Optimize. One learning I can mention outright is that each question answered begets another one to consider. It occurs that there is no end to the insights ahead, nor the work to improve this website. This post will focus on the progress to date.
Goals and Events
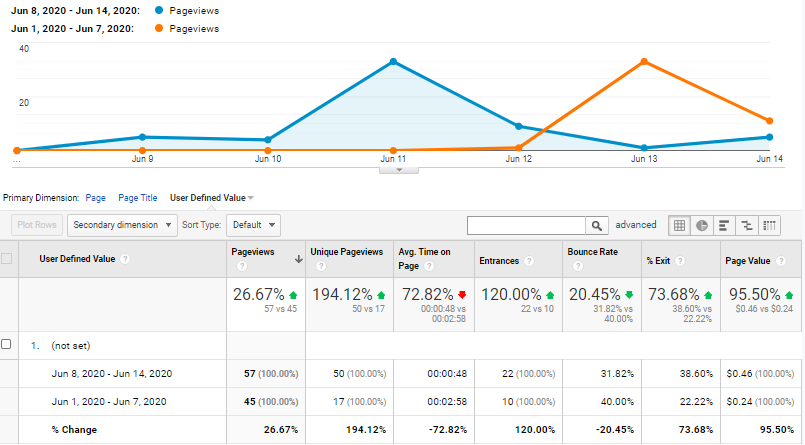 Pageviews overview week over week.
It's interesting how goals I thought I really wanted to get fulfilled have changed as data about user behavior increases. With an eye on the report of week over week activity, I'm stunned at what a difference a week makes.
- Pageviews: Up by over a quarter in the last week. I did make a few more requests of family and friends since starting the Optimize portion of the experiment. Unique Pageviews is up by nearly a 200%
- The average time on a page was about 31 seconds, and has decreased by over 72% in the last week. Why? I don't know for sure, but that's one example of the developing goals I mentioned. If the increase in visiting and pageviews correlates to returning users, maybe the more familiar don't need as much time on any one page. Maybe the returning user can concentrate on what she finds interesting and not on becoming familiar with the over all content.
- Interestingly, I've started tracking the time on any page in reference to a monetary value. With the improvements in place and the user traffic, Page value on the site has increased by 95% this week, at 46 cents/page from 24 cents/page.
Google Optimize
After learning about Google Optimize software, and some conversations with users, I thought it would be worthwhile to experiment. So, I designed a variant of my index page, where there's a new dropdown that directs you to the latest posts (excluding post 9 and this one). This experiment was intended to show more conversions, as they were led to a newer, more compelling post.
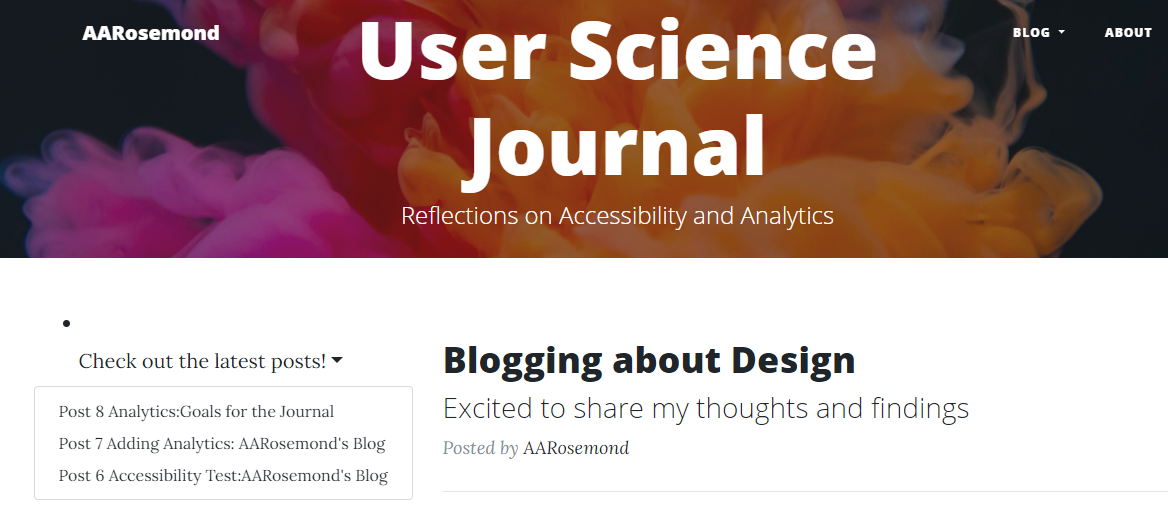 Variant 1: Let's try making it easier to see the latest
post.
Variant 1: Let's try making it easier to see the latest
post.
The results are at once encouraging and startling.
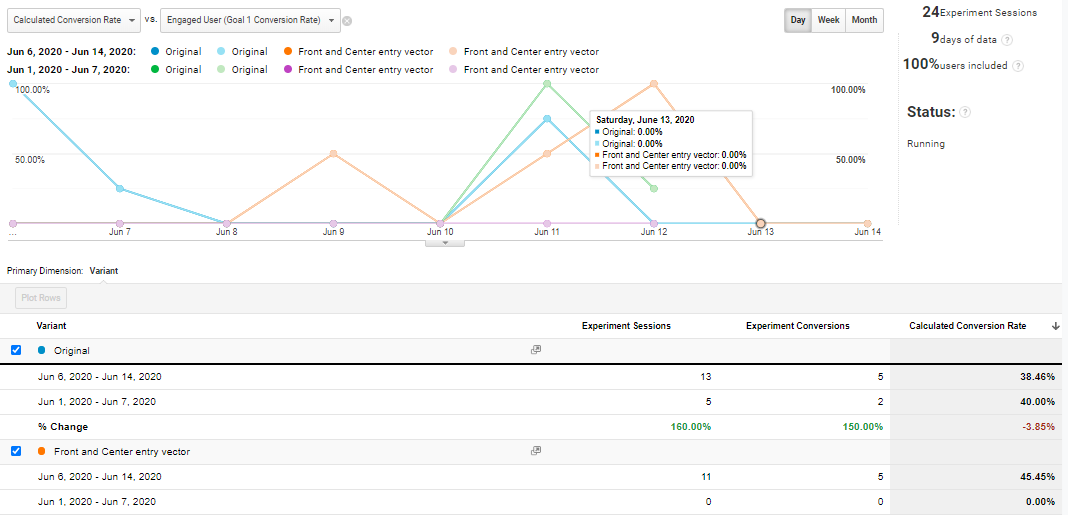 Variant 1: 9 days worth of observations.
Over the 9 days of observation so far:
- Week 1: 2 of 5 users met the conditions we'd call "conversions" (40%)
- Week 2: 5 of 13, or 38% met the conditions.
- Week 1: The experiment hadn't started, so no data yet.
- Week 2: 5 of 11, or over 45%, met the conditions. That's in one week.